


New Zealand 2025 - Gas Reserves Analysis
Taking a deeper dive into the 2025 gas reserves annual update.

In my opinion New Zealand’s domestic natural gas supply is currently our most pressing energy security issue. The reason I say this is that effects nearly all our primary industries and the electricity sector. The decline is happening very fast, the scale of the problem is huge, and we don’t have any readily available alternatives to turn to.
The data.
On the 5th of June MBIE published the 2025 annual reserves update. I did a quick post at the time that can be found here.
In this most recent update MBIE also published the last ten years of reserve data. This is great and it can be combined with the MBIE gas data tables to get a higher resolution picture of our situation.
This piece is a quick and dirty look at some of this data to give a high-level overview of our predicament.
It was a bit of a headache to aggregate all these spreadsheets together as the sequencing and formatting seems to change from year to year. I have suffered through it to pull it all together, so you don’t have to.
Context.
First some context.
In addition to electricity generation the following industries are all dependent on natural gas to some extent:
Food processing.
Dairy.
Forestry.
Horticulture, agriculture and fishing.
Ammonia urea fertiliser.
Methanol production.
Steel.
Various small to mid-size commercial operations.
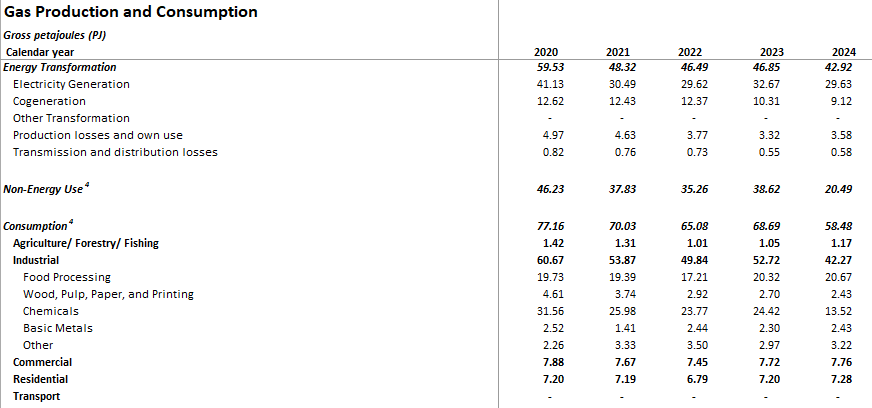
MBIE gas consumption tables for the past 5 years.

Last year we had a total gas consumption of 119 PJ (Peta Joules) which is the lowest it has been since 1984.
This is not due to a lack of demand, this is due to a lack of supply.
Industries across New Zealand remain hungry for gas and don’t have any good alternatives. All are struggling to secure gas contracts. Those who have managed are experiencing significant price increases sometimes exceeding 20%.
New Zealand’s gas supply is dropping fast.
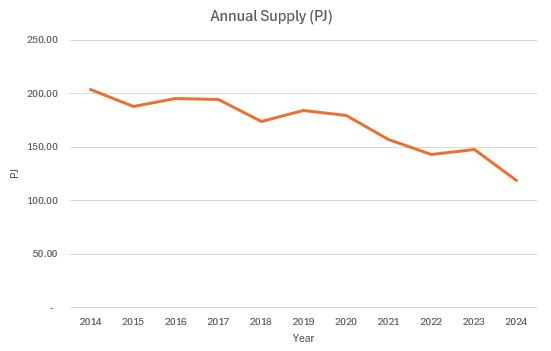
The chart above shows the supply over the past 10 years. Note the steep decline from 2023 onwards.
We are getting close to having half the gas available that we had 10 years ago. Which translates to approx. 100PJ of energy missing from our economy each year. To put this in context 100PJ in sheer energy terms is roughly enough energy to meet the needs of 3.7 million average New Zealand homes (note NZ doesn’t even have that many homes).
As the supply rate drops so too does the deliverability rate, which is essentially the flow rate. This is something to keep an eye on as the New Zealand gas market has peak demand periods which tend to be later in winter, particularly in a dry year. This is due to high usage by gas turbines for peaking power generation and high use by Fonterra for flush milk production starting in September.
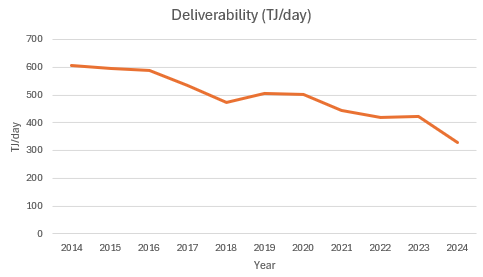

As a side note. - Using a wide boundary analysis Fonterra’s electrification at Whareroa doesn’t really help. It will likely just move the gas from their boilers to the the electricity generators gas turbine peaker plants. Also, Fonterra’s electrification does not cover all sites and there is still a large gas requirement vulnerability.
Reserves
This brings us to the critical question for so many New Zealand businesses. How much gas do we have left?
This is a surprising hard question to answer for several reasons. I would generally classify these reasons as follows using simple layman terms (for this is what I am):
New Zealand’s existing gas fields, mostly sedimentary basins, are all typically mature and somewhat depleted. Depleted wells can be quite unpredictable in late life. Often drawing from close to a water interface or lowering in pressure which can change their performance characteristics.
Processing facilities can become difficult to manage at lower turndown rates resulting in production constraints.
The reservoirs are non-uniform in shape and structure. Pockets of gas that may be considered available may in fact turn out to be stranded and inaccessible without drilling into a different part of the formation.
There are fields that have been explored but not appraised. How much gas they contain, and if it is actually gas and not oil carries a high degree of uncertainty.

Reserves from existing fields are generally rereferred to as “proven, probable, possible” or in short “P”.
1P reserves = proven reserves (both proved developed reserves + proved undeveloped reserves).
2P reserves = 1P (proven reserves) + probable reserves, hence "proved AND probable."
3P reserves = the sum of 2P (proven reserves + probable reserves) + possible reserves, all 3Ps "proven AND probable AND possible."
It should be noted that even “1P proven” should be taken with a pinch of salt. There are uncertainties here too, this is far from guaranteed. The level of uncertainty is just lower than that in the 2P & 3P profiles.
As a general rule of thumb, the 1P figure is the one I take the most notice of as it is the most reliable in terms of what is available. I generally think of it as the 1P is like “kind of knowing” and the 3P is “a lot of hoping”.
1P is for customers looking at how much fuel is in the tank. 2P and 3P are the domain of highly specialised geologists and reservoir engineers who are trying to give oil and gas executives a steer on where to invest.
Another thing to consider is that to convert 2P reserves to 1P generally requires an action to be taken, typically drilling. It could be a new well in a different part of the reservoir to get to a stranded pocket or it could be perforating an existing well to access a new zone.
We can view the difference between the 1P and the 2P as the difference between what can be likely be produced with no further activity, and what has most potential to be produced with some further in field development.
So, let’s take a look at the overall 1P & 2P profiles and see what we can deduce about the future of our gas supply.
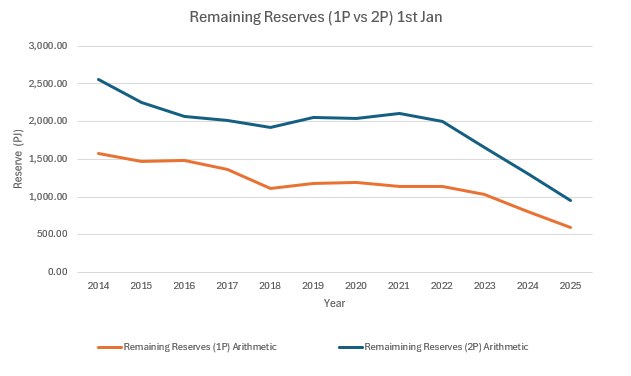
We can see a couple of important things here:
On the 1P profile we had about three times as much ten years ago with a quite large difference between the 1P and 2P profiles which would suggest there was scope to increase the available reserves by converting 2P to 1P.
After quite a drop between 2014 - 2018 things leveled out from 2018 - 2022. Noting that there was still a lot of upside potential in the 2P profile. There was also quite a lot of drilling during this period which was offsetting consumption to give a relatively flat profile.
From 2022 we have seen the decline rate increase and the 1P & 2P profiles converging. This would imply that there is less potential upside can be achieved by converting 2P to 1P.
This is quite worrying when we consider that this data is already more than six months old and the clock is ticking.
There is also currently not a lot of action being taken to convert 2P to 1P or find new reserves. There are two land rigs in operation which is good, but considering the decline we are seeing this is insufficient to shore up our gas supply.
What is driving the decline?
To establish where the decline is coming from and where the potential for increased supply resides, we need to have a closer look at the various fields.
The follow chart shows the main producing fields reserve profiles over the past 10 years.
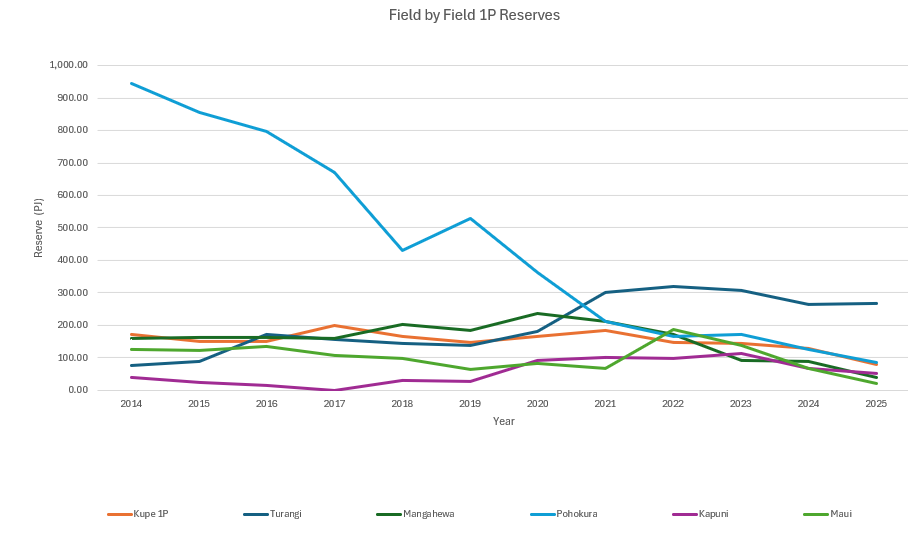
Here we can see that the Pohokura reserves have dropped significantly over the last 10 years. This was a been a very productive field over the years and provided New Zealand with a lot of gas.
A recognition of the contribution of Kapuni also. New Zealand’s oldest field and still chugging away but it too is starting to drop off more recently.
The other thing we can see here quite clearly is that from about 2022 / 2023 all the fields with the exception of Turangi have started to decline noticeably.
Is there any hope?
In the short term, yes.
The Turangi field looks encouraging, it is onshore and has a drilling program in progress.

The Kaimiro field also looks encouraging although much smaller, it is also onshore and also has a drilling program in progress.
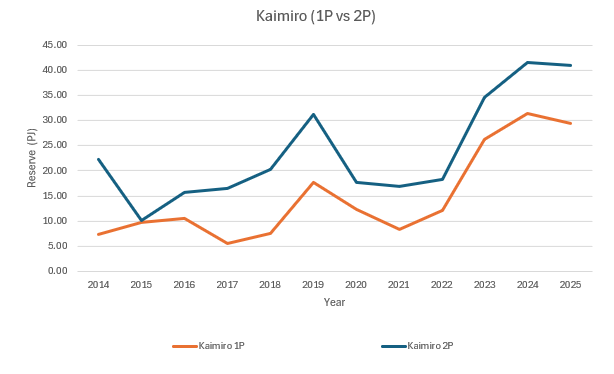
The caveat with both of these is that there is still not a lot of gas in the big scheme of things. At our peak in 2001 we were using 242 PJ / year. The Turangi 2P reserves above are ~400 PJ in comparison.
These drilling campaigns will undoubtedly be critical to keep New Zealand’s industrial base alive in the short term, but the urgency remains. We need a lot more gas to be bought online.
Things take time.
Turangi and Kaimiro being onshore helps. Onshore drilling is cheaper and far easier meaning that there is a much higher chance of 2P being converted to 1P in the near term.
However, we still need more, much more, especially if we want to wean ourselves off our imported coal dependency and to allow New Zealand’s industries survive and to grow.
The greatest potential for boosting our gas supply and energy security will likely be found offshore. There are some potential prospects offshore. For more information on those prospects, I direct you to a very informative interview on RNZ with Mac Beggs a retired and very insightful geologist.
However, my caution with these potential options is that they would take time to develop.
Having a mining permit is only the beginning of the consents and approvals required to drill a well offshore in the EEZ (Exclusive Economic Zone). The consenting for an appraisal well would likely be 18 months at an absolute minimum and this is of only if specifics like well design and the rig to be used are known.
To bring any of these into production will take several years, at least 5 in the absolute best case and more likely 10. This is now time we do not have with only 599 PJ of 1P reserves available - maybe.
P.s. This was a quick and high-level post, there is a lot more nuance that I did not have the time to go into unfortunately. However, I now have a pretty handy little database and will do some more analysis for future posts.
Thanks for reading. If you think these issues are important hit that like and subscribe buttons, it tickles the algorithms and helps to get the word out.
Larry
Appreciate your expertise and analytical skills, as always.
Many thanks for taking the time. Scrolling through the different formatting is rage inducing.
Gearing up for a train wreck with what you outline combined with the full spectrum ineptitude of the political class. 🥲