
Doing the Math.
Putting some numbers to the narrative.

My last piece, The Math Ain’t Mathing, generated quite a bit of interest.
The executive summary of that piece is that there are three separate ideas currently circulating in New Zealand’s energy commentary:
We don’t need LNG imports.
We can electrify transport and industrial heat.
We can accommodate major new electricity loads such as data centres.
As I noted in that piece, each of these propositions sounds reasonable when considered in isolation. Viewed collectively though, the arithmetic starts getting a bit wobbly.
Since publishing that piece I have been thinking a lot about the bigger picture and what the system would need to look like to actually achieve the three aspirations simultaneously over the next decade.
New Zealand currently generates approximately 44 TWh of electricity each year.
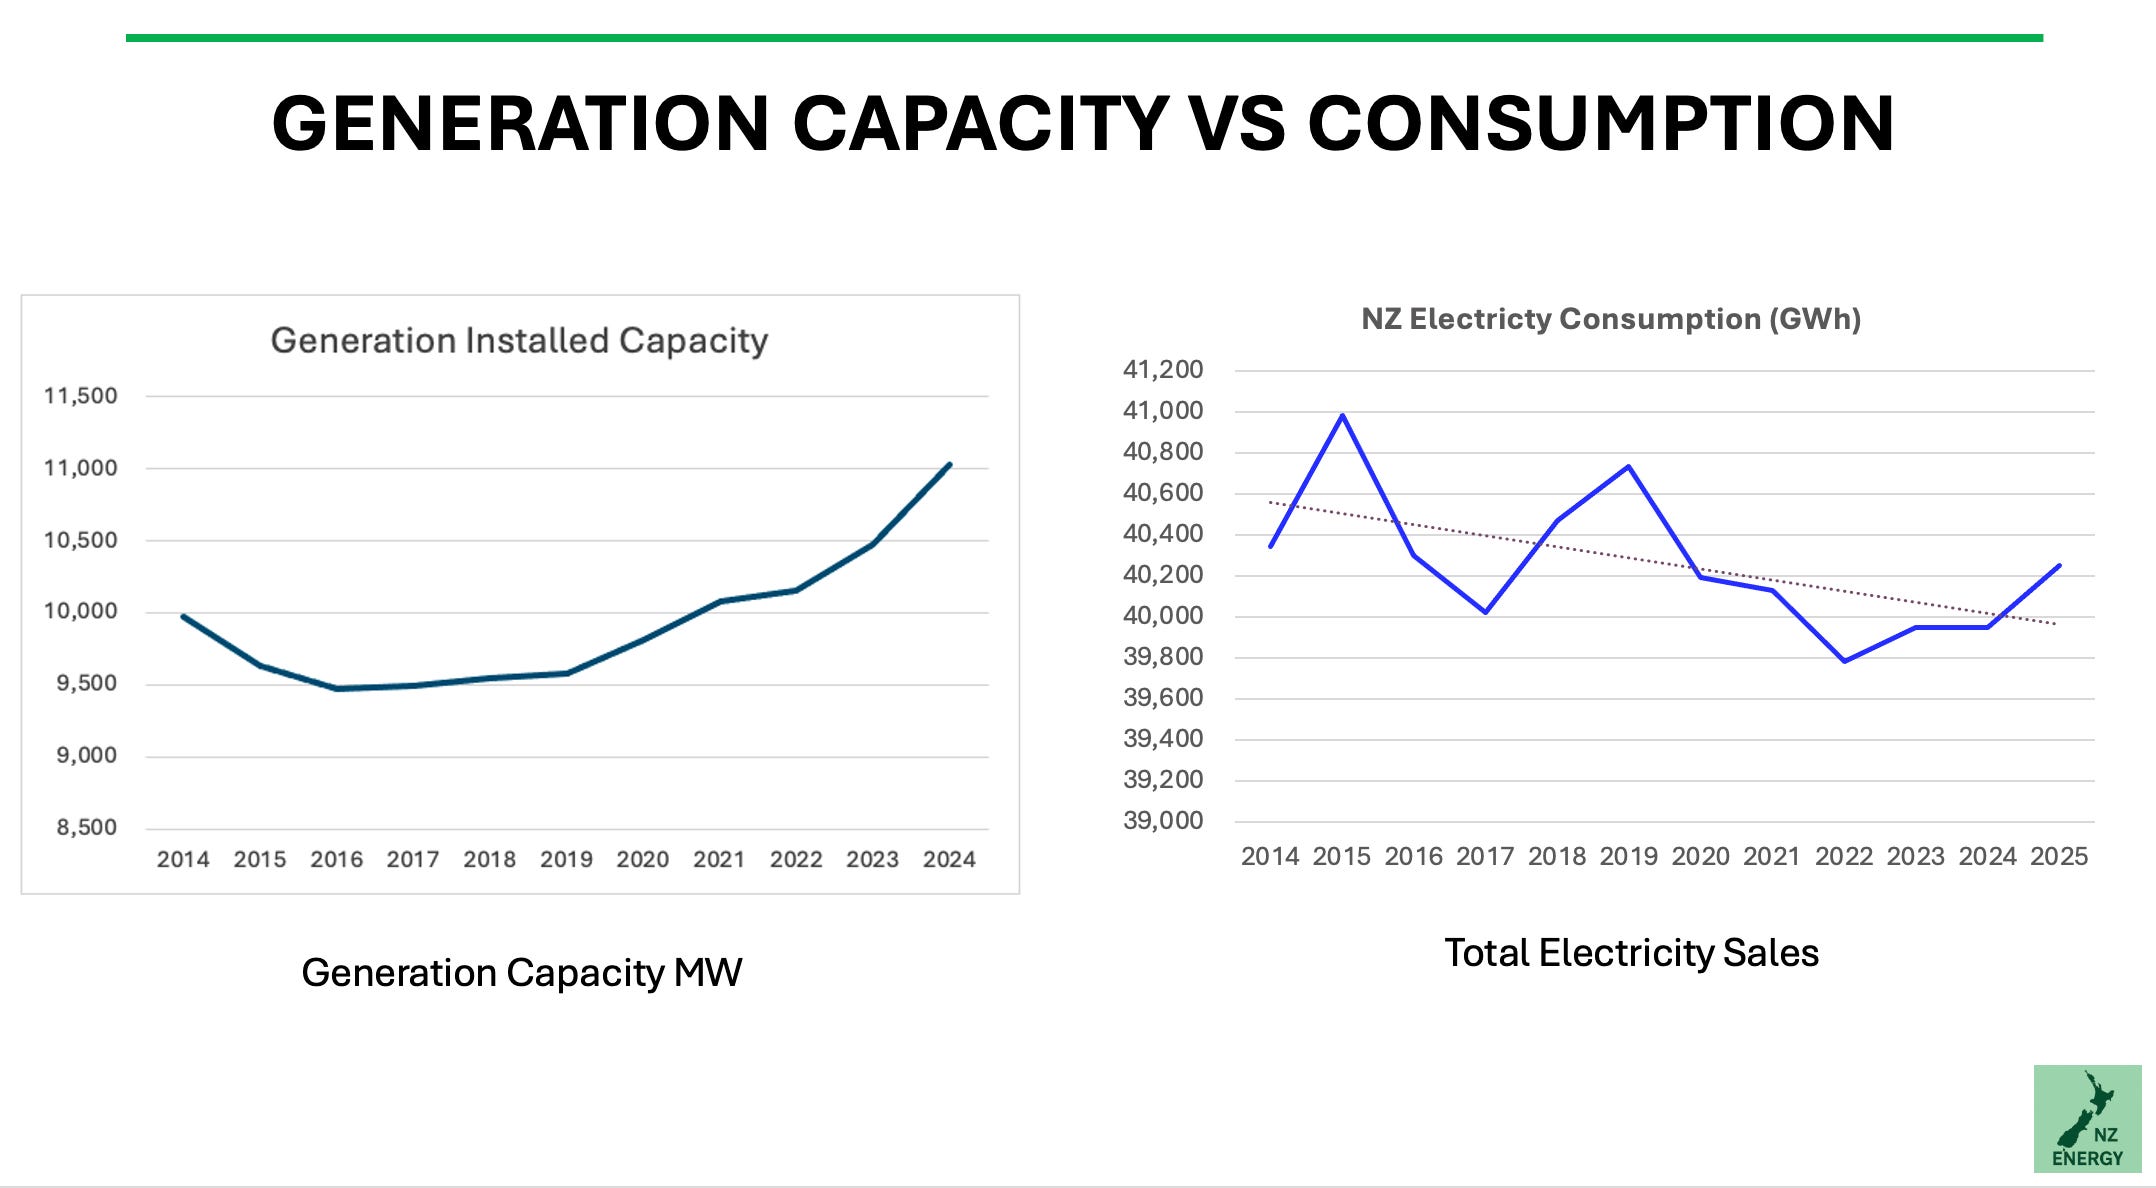
That number has barely changed over the last decade despite substantial investment in new generation. Over that same period, however, installed nameplate generation capacity has increased by almost 11%. I discussed this curious observation in a piece last year called Divergence, noting that despite building more generation capacity, New Zealand was actually consuming slightly less electricity than a decade earlier. This trend is driven by a large fall in electricity use by industry, in other words, deindustrialisation.
This observation sits at the heart of my scepticism about whether these three narratives can all be true at the same time.
Back of the envelope maths
To answer the question of how realistic it is to simultaneously electrify commercial and industrial gas users, progressively electrify transport and accommodate an additional 1 GW of data centre load, I built a very simple back of the envelope model based on a handful of assumptions.
Now, in the wise words of George E. P. Box, “All models are wrong, but some are useful.”
In the case of my modelling, it’s quick, dirty and probably doesn’t even meet the definition of a model, but I think it is directionally useful.
The assumptions
The assumptions are as follows:
Firstly, New Zealand does not import LNG and can adequately cover a dry year with low hydro inflows.
Secondly, declining domestic gas production is progressively replaced through a combination of biomass and electrification using the assumptions contained within PwC & Enerlytica’s 2026 Gas Supply & Demand Study together with EECA’s RETA (Renewable Energy Transition Accelerator) analysis.
It is important to note that this assumption excludes Methanex and Ballance Kapuni. These facilities use natural gas primarily as a chemical feedstock rather than simply as a source of process heat and therefore cannot realistically be electrified or converted to biomass. In this scenario they are assumed to exit the gas system rather than become new electricity loads.
Thirdly, the EV share of New Zealand’s passenger vehicle fleet increases by 5% per annum over the next decade.
Fourthly, data centres add a cumulative 100 MW of new load each year over the next decade, equivalent to approximately 1 GW of continuous demand by 2035.
Fifthly, the bit that is almost always overlooked in these assessments, economic growth.
The economy, at its core, is simply energy transformed into goods and services. With the exception of the data centre assumption, every additional load included here represents a substitution rather than growth. Electrifying transport does not transport more people. Electrifying industrial heat does not produce more milk powder. These assumptions simply allow today’s economy to continue operating using a different energy carrier.
If we expect the wider economy to continue growing indefinitely, which is naïve, but for the sake of this discussion we will assume it can, then we require an additional net energy surplus in addition to these substitution loads.
As Alfred Lotka recognised more than a century ago, organisms, and by extension economies, compete by capturing and utilising more available energy. Put another way, part of our energy system is required simply to maintain the existing build infrastructure, while any increase in production requires additional energy on top of that.
For this reason I have assumed that general electricity demand, in addition to the substitution loads above, grows at 2% per annum. This is not intended to be a forecast. Rather, it is an allowance for the additional energy required to maintain existing infrastructure while providing a modest surplus with which the wider economy can continue to grow.
Finally, we also have to consider generation that reduces demand on the grid by supplying electricity behind the meter. To offset the increases above I have included growing residential rooftop solar, farm solar, commercial rooftop solar and the Government’s school solar programme.
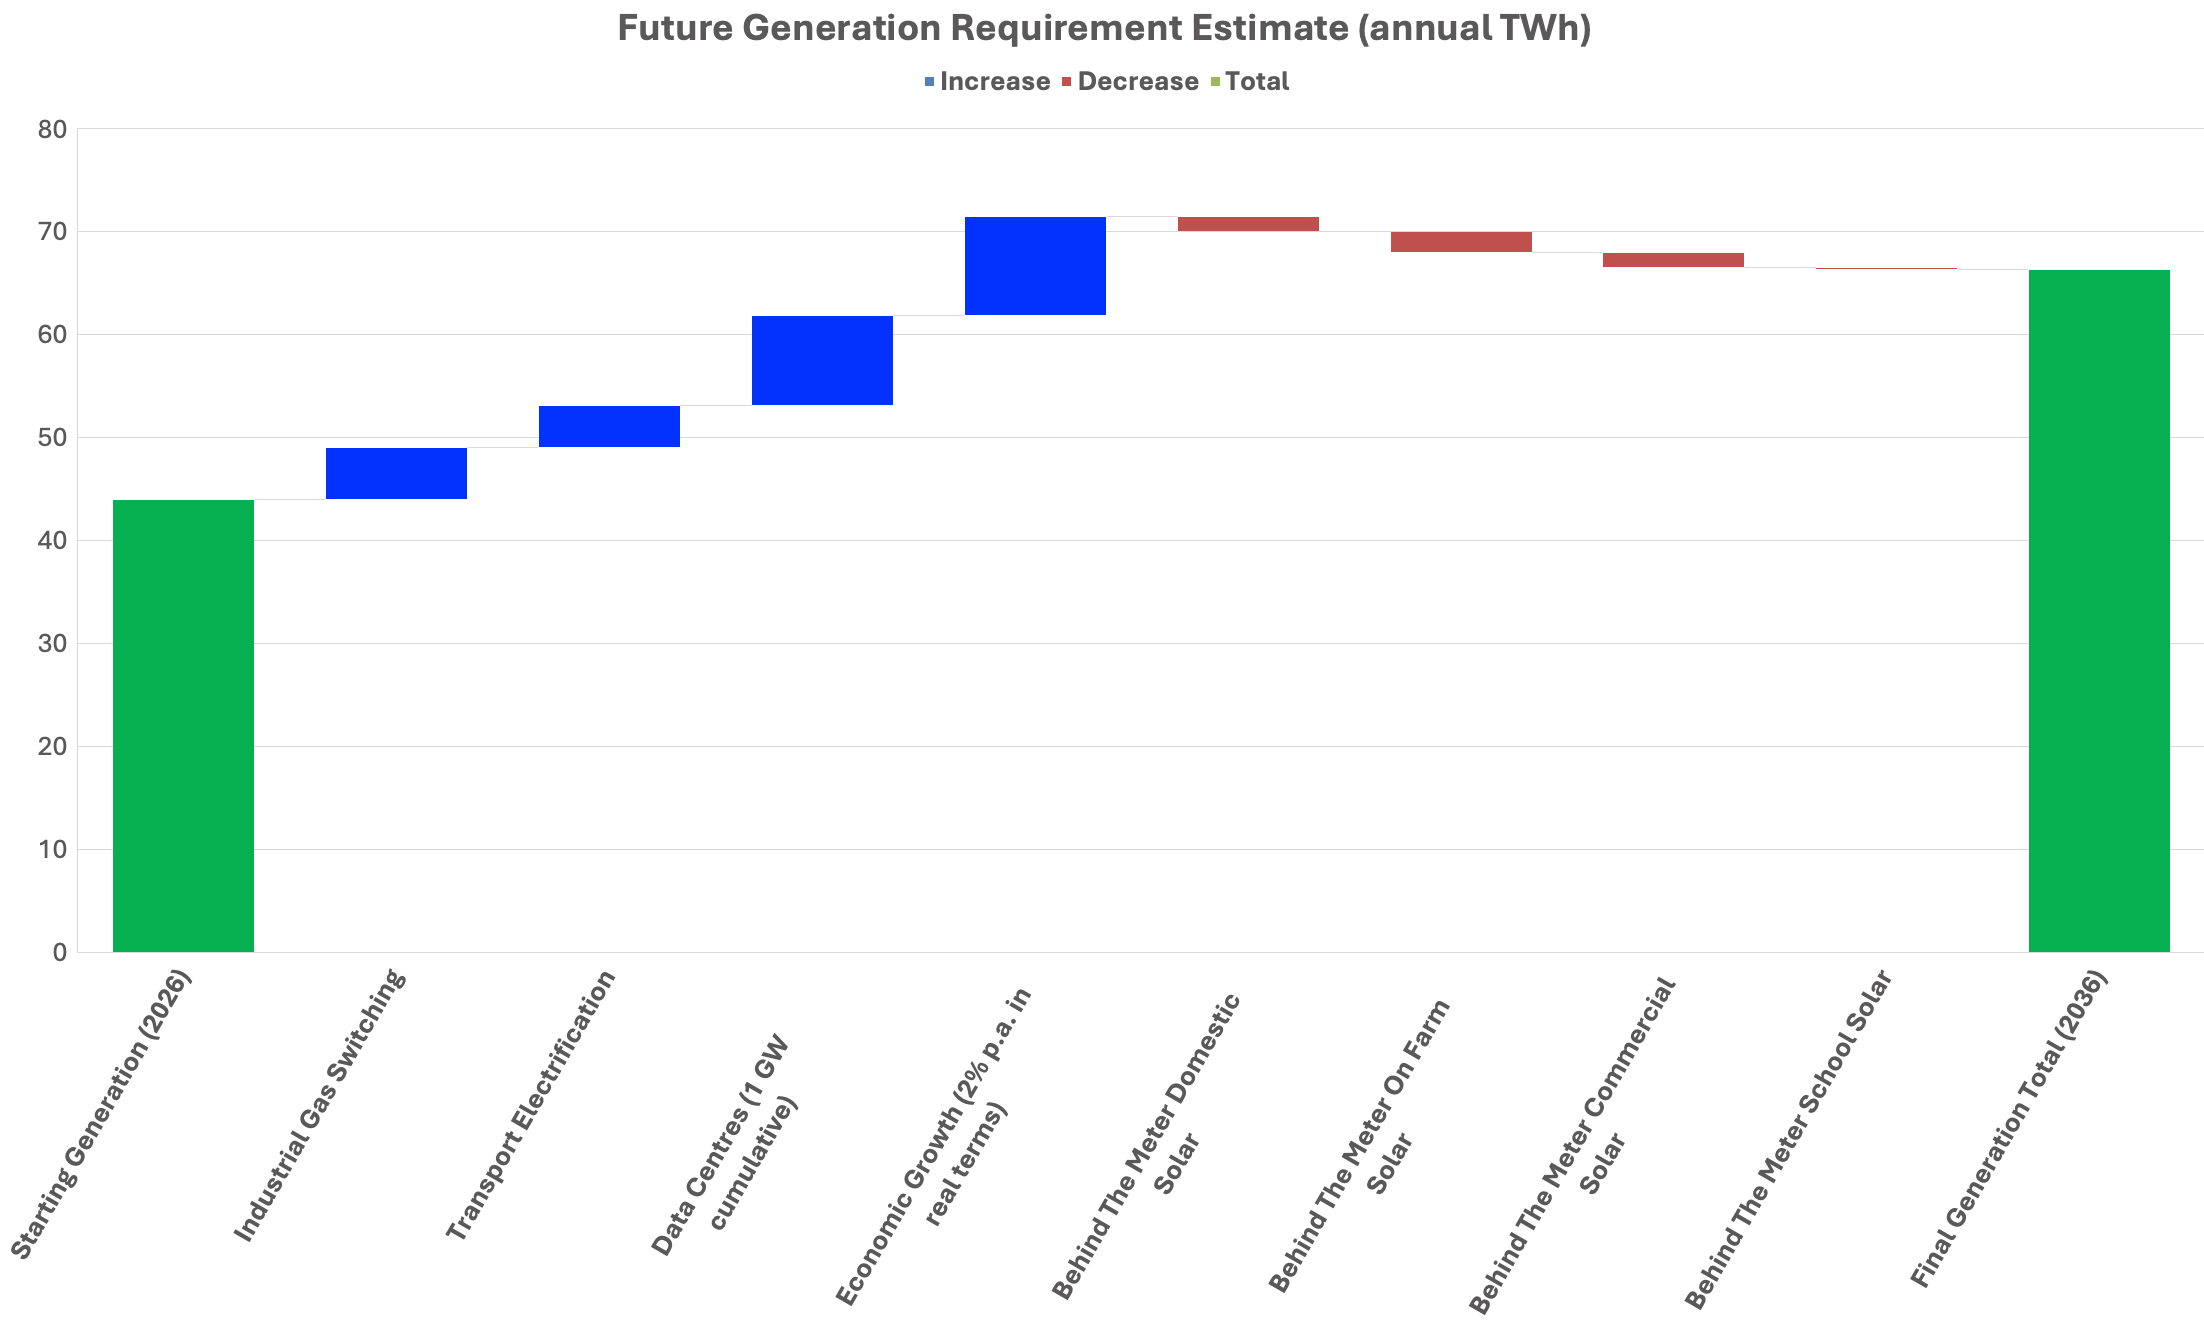
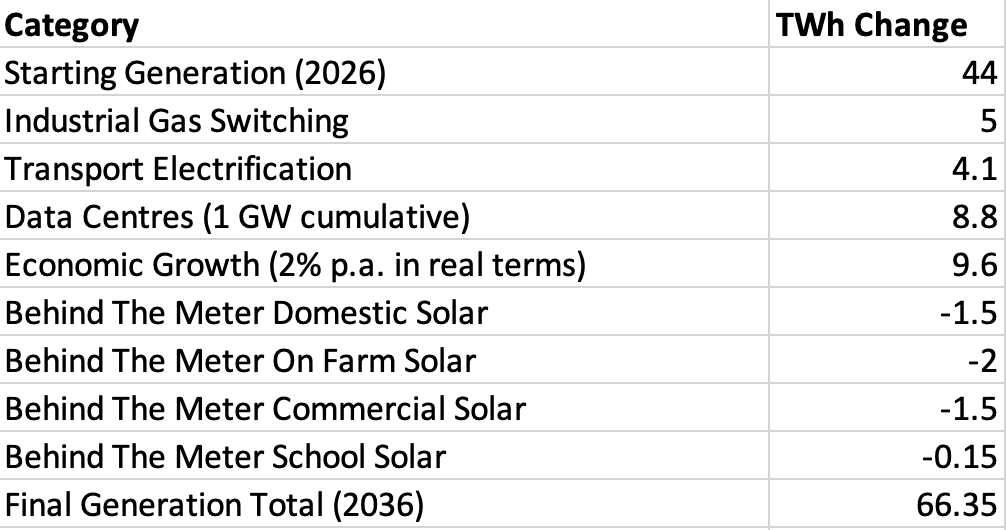
The resulting waterfall chart is shown below. Again, this is far from a detailed system model, but I believe it is directionally representative of the additional electricity demand we could expect if New Zealand attempted to pursue all of these objectives simultaneously.
Efficiency and Exergy
Energy aware readers will notice that I have not included efficiency improvements as a reduction in electricity demand. This omission is deliberate.
The first reason is Jevons Paradox.
Since the Industrial Revolution, improvements in efficiency have rarely translated into proportional reductions in energy consumption. Instead, they reduce the cost of production, allowing more economic activity to occur. Counterintuitively, this typically results in more energy being used rather than less, or at the very least the same amount of energy doing more work. It in essence lowers the unit cost of production which in turn increases production.
The second reason is that not all energy is equal.
Electricity is a high-exergy energy source. It can be converted into useful work with very high efficiency because it does not rely on combustion and heat transfer, both of which involve significant conversion losses. It is ideally suited to powering motors, electronics, lighting and many industrial processes.
By contrast, much of the natural gas currently consumed by industry is used for comparatively low-exergy purposes such as process heat. In many applications a large proportion of the energy is ultimately rejected as waste heat rather than being converted into useful work.
At first glance this might suggest that electrification will require substantially less energy than the gas system it replaces. In many cases that is true. A heat pump, for example, can deliver several units of heat for every unit of electricity consumed.
However, this is very much a case-by-case assessment.
It also does not account for the grid infrastructure we need to build and operate in order to supply firm electricity to industry, which needs to be considered but is a much bigger full system cost of electrify topic for another day.
Rather than attempting to estimate these efficiency gains myself, I have adopted EECA’s RETA (Renewable Energy Transition Accelerator) assumptions for industrial fuel switching.
RETA already accounts for the practical realities of fuel switching, including the proportion of loads that are better suited to biomass, those that can be electrified directly, and the efficiency gains achievable when low-temperature process heat is converted to technologies such as heat pumps.
Applying an additional exergy adjustment on top of RETA would therefore risk double counting those efficiency gains.
The analysis captures efficiency improvements where they are already embedded within RETA, but does not assume that efficiency alone will offset the substantial increases in electricity demand arising from fuel substitution, transport electrification, data centres and the additional net energy surplus required to support economic growth.
Efficiency determines how much electricity is required to perform a particular task.
It does not eliminate the need for additional electricity if society simultaneously chooses to electrify transport, replace natural gas, accommodate large new industrial loads and continue growing the economy.
The Result
The result is a bit of a shock, excuse the pun.
Industrial gas fuel switching adds approximately 5 TWh.
Transport electrification contributes around 4 TWh.
The cumulative impact of adding 100 MW of new data centre load every year for a decade approaches 9 TWh.
Providing the additional net energy surplus required to maintain infrastructure and support modest economic growth adds almost another 10 TWh.
Even after allowing for increasing domestic rooftop solar, on farm solar, commercial rooftop solar and the Government’s school solar programme, my rough calcs suggests New Zealand could require close to 70 TWh of total electricity generated per year within the next decade.
That is approximately 25 TWh more than we generate today, an increase of nearly 60%.
Put another way, we would need to build another electricity system more than half the size of the one we currently have.
In another follow-up piece I’ll compare these assumptions with the Electricity Authority’s generation investment pipeline. Spoiler alert, while the pipeline appears very large on paper, not all of it will be built, and with more than 80% of proposed capacity being intermittent, delivering an additional 23 TWh of reliable electricity is considerably more challenging than simply adding another 23 TWh of nameplate generation. The physical practicalities of fuel switching our commercial and industrial gas users is another huge challenge. More on all of this another day.
P.s.
If you’re finding value in these pieces, the best way to support this work is by subscribing, reading, sharing, and engaging with them.
I publish these pieces freely in the hope they help people better understand the role of energy in our lives.
It costs nothing to subscribe or access the full back catalogue of over 150 articles that can be found here. However, if you choose to become a paid subscriber, that’s greatly appreciated, it allows me to dedicate more time to researching and writing.
Larry
P.s. More detail on the assumptions
The purpose of this article is not to build a detailed electricity market model. Detailed modelling of this nature is incredibly complex and needs to run on a second by second basis with an increasingly wide range of generation and load scenarios. This piece is simply intended to understand the order of magnitude of the challenge if New Zealand attempts to simultaneously replace declining gas production, electrify transport, accommodate significant new electricity loads and continue growing the wider economy.
The assumptions below are intentionally transparent so you can substitute your own values if you disagree with mine.
1. Industrial gas fuel switching: +5 TWh
This assumption is based on using the engineering work undertaken through EECA’s Renewable Energy Transition Accelerator (RETA) rather than assuming a one-for-one replacement of gas with electricity.
It is also important to note that this estimate excludes Methanex and Ballance Kapuni. These facilities primarily use natural gas as a chemical feedstock rather than simply for process heat and therefore cannot realistically be electrified or converted to biomass. In this scenario they are assumed to exit the gas system rather than become new electricity loads.
Workings
• Assume the industrial and commercial gas shortfall requiring substitution is approximately 25 PJ/year.
• Convert to electricity equivalent.
1 TWh = 3.6 PJ
25 PJ ÷ 3.6 = 6.9 TWh
• RETA assumes part of this demand is met through biomass and that electrification of low-temperature process heat benefits from significant efficiency gains through technologies such as heat pumps.
• Applying a moderate adjustment for these effects reduces the electricity requirement to approximately 5 TWh.
2. Transport electrification: +4 TWh
This assumption is based on the EV share of New Zealand’s passenger vehicle fleet increasing by approximately five percentage points per year over the next decade.
Rather than assuming the entire transport sector electrifies, I have assumed passenger vehicles progressively replace petrol consumption while heavy transport remains largely diesel powered.
Workings
• Annual petrol demand approximately 84 PJ.
• Current EV fleet share approximately 3%.
• EV fleet share after ten years approximately 53%.
• Petrol displaced
84 PJ × 53% = 44.5 PJ
• Electric vehicles require approximately one-third of the energy of equivalent petrol vehicles.
44.5 PJ × 33% = 14.7 PJ
• Convert to electricity
14.7 PJ ÷ 3.6 = 4.1 TWh
Rounded to 4 TWh.
3. Data centres: +8.8 TWh
This assumption simply reflects a cumulative addition of 100 MW of continuous data centre load each year over the next decade.
Workings
• 100 MW added each year × 10 years = 1,000 MW.
• Annual energy
1,000 MW × 8,760 hours = 8,760,000 MWh
= 8.76 TWh/year
Rounded to 9 TWh.
4. Net energy surplus for growth: +9.6 TWh
This assumption differs from the previous three because it is not a substitution.
Replacing petrol with electricity does not transport more people.
Replacing gas process heat with electricity does not produce more milk powder.
These assumptions simply allow today’s economy to continue operating using a different energy source.
If the wider economy is expected to continue growing, however, it requires an additional net energy surplus beyond those substitution loads. This reflects the need to maintain existing infrastructure while also providing additional energy for new productive activity.
Workings
• Existing electricity generation = 44 TWh/year.
• Assume an additional 2% annual growth in electricity demand over ten years.
44 × (1.02¹⁰ − 1) = 9.6 TWh
Rounded to 10 TWh.
5. Behind-the-meter solar: -4.1 TWh
This assumption recognises that not all additional electricity demand needs to be met by grid-scale generation. An increasing proportion is likely to be supplied in a distributed way behind the meter through residential rooftop solar, commercial rooftop systems, on farm solar and batteries. From a grid perspective this can reduce the demand for grid scale generation which is why I have shown it as a reduction in my waterfall chart.
The scale of behind the meter solar and its trajectory is a bit hard to gauge. There is no single authoritative published forecast for behind the meter generation in 2035.
I have leant heavily on the work done by rewiring Aotearoa to develop my estimates.
Residential rooftop solar:
Rewiring Aotearoa’s modelling for replacing approximately 12 PJ of LNG imports estimated that around 115,000 rooftop solar systems, together with widespread electrification of hot water, could contribute approximately 1.5 TWh per year. This would suggest that multi-terawatt-hour contributions from distributed generation are plausible. Rewiring Aotearoa – Why Solar Makes Sense
I have gone with their figure for domestic solar assuming this could be achieved over the next decade.
• Residential rooftop solar = 1.5 TWh
On farm:
Rewiring Aotearoa makes a strong case for on farm solar and personally I think it’s quite an elegant solution when you consider chilling milk and irrigation, but there is no national TWh forecast that I could find.
One useful number appears in Rewiring Aotearoa’s dry-year work. They suggest that 30,000 farms with 300 kW systems would produce around 225 GWh of additional electricity during the critical dry-year period.
This figure of 225 GWh is only for the dry-year uplift period, not annual production. If annualised using a 16% capacity factor 30,000 × 300 kW = 9 GW
Annual production ≈ 12 TWh/year
This represents what is technically possible but its not realistic within a decade for the simple fact that the rural networks couldn’t handle it without major upgrades. Today, many rural feeders already reach export limits with relatively modest levels of solar export.
I have used a much more conservative figure for on farm solar within the next decade for this reason. While the technical potential for on farm solar is huge, the widespread deployment at that scale would require significant investment in rural distribution networks, storage and local load flexibility to accommodate reverse power flows. I don’t think we could even get through the debate around who is going to pay for those upgrades let alone complete them in a decade. As such I have used a figure that is credible for our existing networks without major upgrades. It would still represent a big increase in on farm solar capability.
• On farm solar = 2 TWh
Commercial / warehouse solar:
Again I couldn’t find a national TWh target.
However EECA’s commercial solar work suggests that commercial roofs are generally good solar sites, daytime loads align very well with the solar generation profile, and that many businesses can economically install systems from 10 kW to 1 MW.
I have chosen the assumption that this could scale in a similar to residential solar.
• Commercial rooftop solar = 1.5 TWh
School solar:
There is enough published information about this program to derive a reasonably accurate figure. Rewiring Aotearoa modelled using 5% of available roof space on all NZ schools and concluded this would produce 108 MW of installed PV.
Assuming a NZ solar capacity factor of about 16%:
108 MW × 8,760 h × 16% = 151 GWh/year
• Government school solar programme = 0.15 TWh
Total reduction in grid supplied electricity = 4.1 TWh
Great analysis, thanks.
One thing that you haven't considered is the value to NZ of the things consuming power. Data centres employ very few and pay minimal tax by offshoring their profit -- why would we want to host them?
The aluminium smelter ditto: it pays less in salaries and wages to NZ staff than it receives in subsidies, and pays less than $5million/yr in corporate tax. Its 5TWh/yr power consumption could be diverted to the 5TWh/yr industrial gas substitution need that you calculate.
Well done, Larry. Back of the envelope is always a good starting point &/or reality checker. I’m totally frustrated that people like you and Rewiring Aotearoa are left to do & lead all this work. I guess it’s necessary when the politicians seem to be beholden to their funders & are telling the bureaucrats to tow the party line.